
StatLine — Analytics for Your UTS Devices
Real-time revenue and gameplay insights for every sandbox, wall, floor and IceHook you own.
What Makes StatLine Invaluable
All devices, one dashboard
View sessions and daily revenue from every iSandBOX, Floorium, Magic Wall and IceHook in one place.
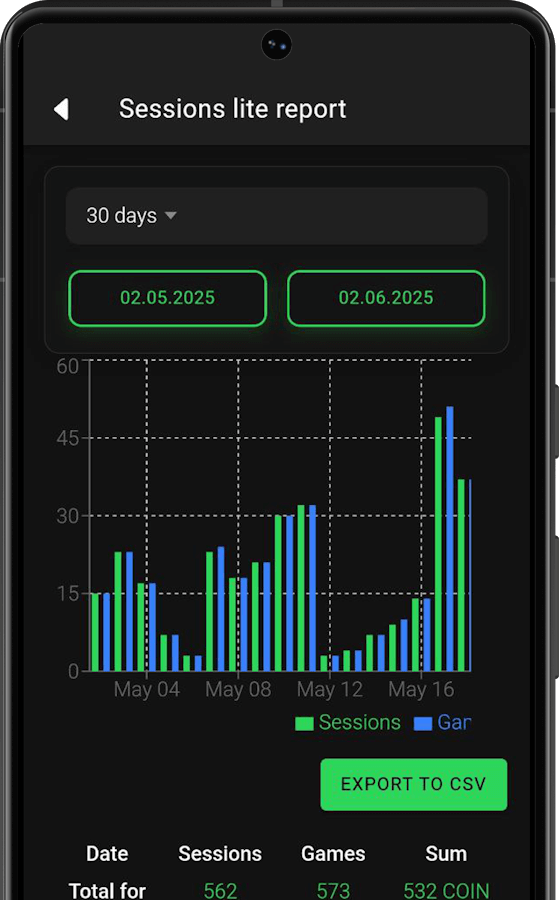
Interactive visual analytics
Filter by date, drill down to any session, spot peaks at a glance with live charts.

1-click data export
Download CSV or Excel files to share with partners, accountants or BI tools.
Actionable revenue insights
Identify top-earning games, peak hours and under-performing attractions instantly
What You Can Track with StatLine
Track how many sessions and games were played each day, and uncover usage trends at a glance.

- Daily counts of sessions and gamesView exact numbers for each day across all your UTS devices.
- Automatic averages and totalsGet the average sessions per day, games per session, and total play activity for the selected period.
- Interactive session & game chartA clean, color-coded graph helps visualize fluctuations and peak usage by day.
Understand how much each device earns per day and track your income trends over time.

- Daily revenue breakdownSee exactly how much was earned each day, per device or across all locations.
- Total and average incomeAutomatically calculates total revenue and average daily earnings for the selected date range.
- Interactive income chartsVisual graphs highlight income fluctuations, peak days, and low-performing periods.
See which games attract the most attention — and for how long.

- Top games by usageTrack which games were played during the selected period.
- Play count and total durationSee how many times each game was launched and the total time users spent in it.
- Pie charts by count and durationInstantly visualize game popularity and engagement through interactive pie charts.
Dive into each individual session to analyze gameplay, payments, and activity duration.

- Full session listView a chronological list of all sessions during the selected time range.
- In-depth session detailsSee which games were played, how much was paid, and how long each session lasted.
- Session count chartA visual timeline shows how many sessions occurred each day to help identify trends.
How to Start Using StatLine
Submit your serial number
Fill out the request form and include your UTS device’s serial number.
We activate StatLine
Our team will verify your device and update it to support StatLine.
Register your account
You'll receive access credentials to sign in and manage your analytics.
Download and start using
Install the StatLine app and start tracking performance instantly.
Simple, Transparent Pricing
Annual Plan
- Data stored for 12 months
- Pay once a year.
- Save €118 — two months free
€590 / year
Subscribe Now
Contact Us
Contact us for more info on product details and demo
Clicking button you agree with company’s privacy policy